
How I used Address Sanitizer to solve a memory bug
or why I should spend a lot more time learning how to debug

I’ve been contributing to an open source machine learning library called mlpack recently. I had this (in retrospect stupid) memory-related bug where the program was crashing at the end. When this happens, I default to using Valgrind because in the past it’s saved me so much time combing through hundreds of lines of code if not thousands. So I tried using Valgrind and Memcheck, which is a dynamic binary instrumentation tool that allows you to catch these kinds of memory issues.
Programs like Valgrind often use a technique called shadow memory that “shadows” every byte of memory. It gives us some useful metadata about the byte that we are accessing, like whether or not it has been allocated. During execution these tools will update the shadow memory when a memory read, write, free or allocation occurs.
A lot of tools use this technique for catching different issues like data races and security related issues. The problem with Valgrind is that it’s painfully slow from all the virtualization (~20x slowdown). From reading up on Valgrind, it takes in your binary, converts it into an internal representation and runs it with a bunch of instrumentation to analyze memory accesses among other things. Valgrinds main benefit is that you don’t need the source code, just the binary. It’s also very thorough. From what I’ve read it can also do some profiling.
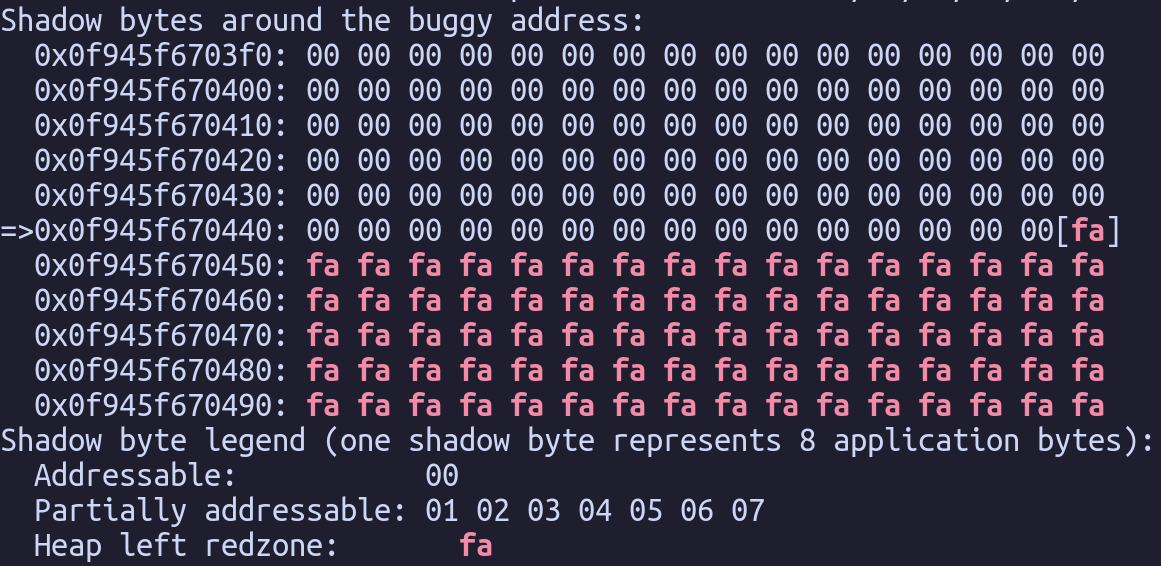
I have the source code, and due to working on machine learning workloads with big tensors doing matrix multiplication and convolutions, I need speed. Instead of using Valgrind, I learned how to use address sanitizer instead. Address Sanitizer (ASan) is compile-time instrumentation, and is a lot more lightweight. You need the source code and it needs to work in your compiler. GCC supports ASan. It only has a ~2x slowdown. After compiling with -fsanitize=address I quickly got useful information.
From this I assumed I was allocating to little memory for what I needed.
ERROR: AddressSanitizer: heap-buffer-overflow ...
... WRITE of size 692224 ...
... mlpack/methods/ann/dag_network_impl.hpp:593
... allocated by thread T0 here:
... mlpack/methods/ann/dag_network_impl.hpp:509
I think this is telling me at line 593 I’m trying to write beyond some memory allocation that I allocated at line 509.
509: layerOutputMatrix = MatType(1, batchSize * forwardMemSize);This gives me the hint that forwardMemSize is probably the wrong. It turns out when I’m computing the size of a concatenation operation, I was computing it like so:
size_t concatSize = layers[i]->InputDimensions()[0]
for (size_t j = 1; j < layers.size(); j++)
   concatSize += layers[i]->InputDimensions()[j];
when it should clearly be done by multiplication. In retrospect this is a very stupid bug that took way to long to find, but after learning about how address sanitizer works and how to use it saved me a lot of time. The lesson here is to get better a using debugging tools.